Even more on news driven trading

News driven trading is even more in vogue today than when I last mentioned it, judging from the increasing number of vendors (e.g. Ravenpack, Sensobeat, Recorded Future, etc.) and researchers pitching their wares. Not only are traditional financial and economic news deemed important, but researchers have found even blog posts (at least those on Seeking Alpha) and Twitter (Hat tip: Satya and William) to be predictive of stock prices.One key ingredient to success in this type of trading is of course the ability to gain access to breaking news ahead of other traders. On the macroeconomic news front, the MIT Billion Prices project has spun off a company called PriceStats to deliver daily consumer product price index to subscribers. PriceStats compiles this index by continuously scanning...

Part 5: How To Annualise Standard Deviation

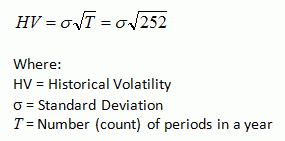
As mentioned earlier, Historical Volatility is actually a standard deviation. The standard deviation can be calculated using historical price data in terms of daily, weekly, monthly, quarterly or yearly. Historical Volatility is then expressed in terms of annualised standard deviation of % price returns, so that it can be compared across different stocks, regardless of the stock price and period used for HV calculation. The formula to annualise the Standard Deviation (that may be calculated using either daily, weekly, monthly, quarterly or yearly) is as follow: Where: HV = Historical Volatility (annualised) Sigma = Standard Deviation for...

Part 4: Understanding Standard Deviation

As Historical Volatility (HV) is calculated using standard deviation, it might be good to understand better about the concept of standard deviation, so that we can interpret the meaning of HV better. Standard deviation is a measure of data variability or dispersion (i.e. how spread out the data points from its mean). When the standard deviation is low, that means the data points tend to be very close to its mean (i.e. the data is spread out over a small range of values). When the standard deviation is high, that means the data points tend to be far away from its mean (i.e. the data is spread out over a large range of values). This can be understood...

Part 3: Steps to Calculate HV using MS Excel (with Example)

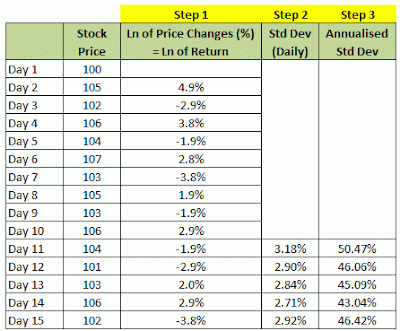
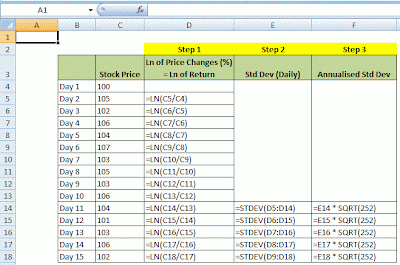
Example for HV Calculation: Suppose we have the daily stock price data and would want to calculate HV for 10-day period (10-day HV). The daily stock price data is in the first two column of the table below: Note: Step 1, 2 and 3 in the table will be described below. Steps to calculate Historical Volatility (using MS Excel): Step 1: Calculate the Price Returns. In this case for the above example, we use formula (4) mentioned in the earlier part (Part 2). However, when the price change is quite small, the price returns calculated using formula (3) or (4) is quite similar. Step 2: Calculate the Standard Deviation of the Price Returns, which...

Part 2: Formula to Calculate HV

As mentioned in Part 1, to obtain Historical Volatility, we need to calculate the standard deviation of the price returns using historical data (which can be in terms of daily, weekly, monthly, quarterly or yearly) over a certain period. Commonly, the daily price data for the period of 10 days, 20 days, or 30 days are used. Theoretically, the formula to calculate Historical Volatility (i.e. standard deviation of % stock�s returns) is as follow: After the standard deviation is calculated, we then need to annualize it. To annualise the Standard Deviation resulted from formula (1) in order to get Historical Volatility...

Part 1: Definition

Historical Volatility (HV) is a measure of the fluctuations of the stock price (i.e. how volatile the prices had fluctuated) over a certain period of time in the past. Suppose the daily closing prices of Stock X and Y for the past 10 days are shown as follows: As can be seen from the data above, regardless of the direction (up or down), the closing prices of Stock X in the past 10 days have fluctuated / changed by $2 to $5, whereas Stock Y by $1 to $3. Since given the same initial stock price of $100, Stock X has shown bigger fluctuation in terms of dollar, Stock X is said to be more volatile than Stock Y. Now, suppose Stock Z has an initial...

Pages 381234 »