Even more on news driven trading

News driven trading is even more in vogue today than when I last mentioned it, judging from the increasing number of vendors (e.g. Ravenpack, Sensobeat, Recorded Future, etc.) and researchers pitching their wares. Not only are traditional financial and economic news deemed important, but researchers have found even blog posts (at least those on Seeking Alpha) and Twitter (Hat tip: Satya and William) to be predictive of stock prices.

One key ingredient to success in this type of trading is of course the ability to gain access to breaking news ahead of other traders. On the macroeconomic news front, the MIT Billion Prices project has spun off a company called PriceStats to deliver daily consumer product price index to subscribers. PriceStats compiles this index by continuously scanning online retailers' websites, and hopefully provides a preview of the official CPI numbers. Whether this is useful for futures and currencies traders is of course subject to their rigorous backtests, though the chart displayed on their website does suggest that the daily price index is a leading indicator of the CPI.

There is an important caveat to using news trading: not all news are equal. So another key ingredient to success is to carefully differentiate between the different types of news and backtest their predictive abilities separately. For example, I recall some research has indicated that an analyst downgrade of a stock from a "hold" to a "sell" rating has more impact than from "buy" to "hold" rating.

My own experience with news driven trading is that for all this trouble, the trading opportunities are relatively few compared to pure price driven trading, the consistency of success is low, and finally the profitability lifespan is short. If you have better experience, do share it with us. 

Part 5: How To Annualise Standard Deviation

As mentioned earlier, Historical Volatility is actually a standard deviation. The standard deviation can be calculated using historical price data in terms of daily, weekly, monthly, quarterly or yearly.
Historical Volatility is then expressed in terms of annualised standard deviation of % price returns, so that it can be compared across different stocks, regardless of the stock price and period used for HV calculation.

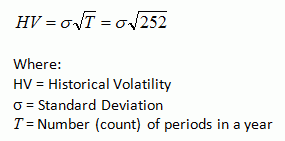
The formula to annualise the Standard Deviation (that may be calculated using either daily, weekly, monthly, quarterly or yearly) is as follow:


Where:
HV = Historical Volatility (annualised)
Sigma = Standard Deviation for a particular time period
T = Number of times (count) of such time periods in a year

So, the value of T in the above formula will depend on the time period of the data used.

In the example used in Part 3, we use daily price returns to calculate standard deviation. Assuming there are 252 trading days in a year, the value of T = 252 / 1 day = 252, because there are 252 times of 1-day period in a year. Hence, we can annualise it by using the following formula:


Just for the sake of giving more examples for better understanding of the value of T.
Suppose that 3-day price return data (i.e. the closing prices for every 3 days) is used to calculate the standard deviation. In this case, the value of T = 252 / 3 days = 84, because there are 84 times of 3-day period in a year. Hence, the formula will be:


In the case of monthly data is used (i.e. using month-end closing prices), the value of T will be 12 because there are 12 months in a year. Hence, the formula to annualise the monthly data is as follow:


For example:
If it is known that the �monthly� standard deviation of Stock ABC�s price returns is 15%, its Historical Volatility will be:


Note:
In Wikipedia, the formula to annualise the standard deviation is as follow:
http://en.wikipedia.org/wiki/Volatility_(finance)


Where:
Sigma = Annualised Volatility
Sigma SD = Standard Deviation for a particular time period
P = Time period of returns (expressed in terms of year)

To annualise a daily (i.e. 1 day) standard deviation, the value of P will be 1/252 (i.e. 1 day expressed in terms of year). So, the formula will be:


This Formula (6) is actually the same as Formula (2), because:


I found some people had commented that the formula in Wikipedia is not right. Actually, the formula is right. But we should understand what the logic is and understand the �definition� for the variables. Do compare the definition for T and P, and notice when we should multiply or divide when we want to annualise from daily standard deviation or to convert the annualised standard deviation into daily standard deviation. Just choose one that can make more sense to you.

Part 4: Understanding Standard Deviation

As Historical Volatility (HV) is calculated using standard deviation, it might be good to understand better about the concept of standard deviation, so that we can interpret the meaning of HV better.

Standard deviation is a measure of data variability or dispersion (i.e. how spread out the data points from its mean).
When the standard deviation is low, that means the data points tend to be very close to its mean (i.e. the data is spread out over a small range of values).
When the standard deviation is high, that means the data points tend to be far away from its mean (i.e. the data is spread out over a large range of values).

This can be understood from the formula below as well:


The numerator in the formula is the summation of the difference between individual data point and the mean of the data set.

If the data points tend to be very close to its mean (less spread out from the mean value), the difference between each individual data point and the mean would be relatively small, and hence the summation of all differences and, in turn, the standard deviation will be small too.

On the other hand, if the data points tend to be far away from its mean (more spread out from the mean value), the difference between each individual data point and the mean would be bigger, and hence the summation of all differences and, in turn, the standard deviation will be big too.

In denominator, �n � 1� is used instead of �n� to get an unbiased estimator, because this standard deviation is derived based on sample, not population. (If the population is used, then the dominator will be �n�).
Since the standard deviation is estimated based on sample, using �n � 1� as the denominator will �inflate� the standard deviation value to �capture more risks� due to estimating the standard deviation based on sample only instead of population. (Remember that to estimate HV, we�ll never be able to use �population�).
This adjustment is particularly essential when we estimate the standard deviation based on a small number of observations (i.e. when n is relatively small). However, when n is big, the difference between using �n � 1� or �n� is not very significant.

Standard Deviation of Normal Distribution
One important attribute of the standard deviation is that in a Normal Distribution, about 66.8% (two third) of the data are within one standard deviation of the mean, and about 95% of the data are within two standard deviations of the mean.

In Historical Volatility, price returns are assumed to be normally distributed, like shown in the picture below.


Source of picture: http://www.russell.com/us/glossary/analytics/standard_deviation.htm

Therefore, about two-third of the time, an individual return would fall within one standard deviation of the mean, and about 95% of the time, an individual return would fall within two standard deviation of the mean.

Part 3: Steps to Calculate HV using MS Excel (with Example)

Example for HV Calculation:
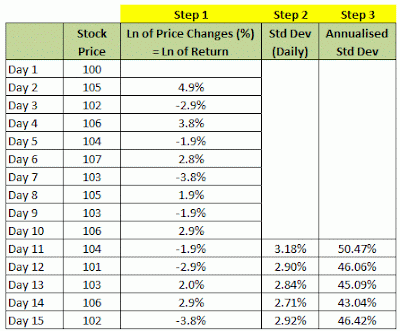
Suppose we have the daily stock price data and would want to calculate HV for 10-day period (10-day HV).
The daily stock price data is in the first two column of the table below:


Note:
Step 1, 2 and 3 in the table will be described below.

Steps to calculate Historical Volatility (using MS Excel):

Step 1: Calculate the Price Returns.
In this case for the above example, we use formula (4) mentioned in the earlier part (Part 2).
However, when the price change is quite small, the price returns calculated using formula (3) or (4) is quite similar.

Step 2: Calculate the Standard Deviation of the Price Returns, which will result in �Daily� Standard Deviation.
In MS Excel, formula �=STDDEV� can be used to calculate Standard Deviation as in formula (1) mentioned in Part 2.

If the period used for calculation is 10 days (like in the example), we�ll use the formula �=STDDEV� for a �rolling 10 days�.
Hence, the Standard Deviation for Day 11 will use Price Return data from Day 2 to Day 11; for Day 12 will be from Day 3 to Day 12; for Day 13 will be from Day 4 to Day 13, and so on.

Step 3: Annualise the �Daily� Standard Deviation in order to obtain the HV.
Since standard deviation is in daily and assuming there are 252 trading days in a year, we can annualise the �Daily� Standard Deviation by using the following formula:


Note:
Different number of days in a year may be used by different site, such as 254 days or 256 days.
252 days is the number of days used in ivolatility.com.


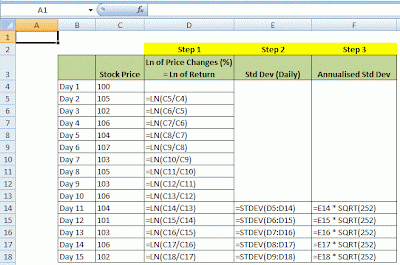
Here is the screen capture of the MS Excel formula used for the calculation in the table above.


Since HV is actually a standard deviation, in order to be able to interpret and use HV data better, it is good if we could have a better understanding on the concept of standard deviation, which will be discussed in the next part.

Continue to: Part 4: Understanding Standard Deviation

To view the list of all the series on �Historical Volatility�, please refer to: