Reading Links

SYMMETRICAL TRIANGLE PATTERN � Part 1: Formation

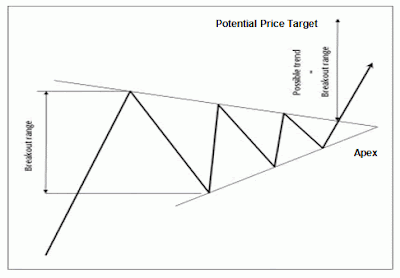
Symmetrical Triangle is a neutral pattern that normally forms during a trend (either uptrend or downtrend) as a continuation / consolidation pattern. The breakout usually occurs in the same direction as the existing trend.

The Formation of Symmetrical Triangle Pattern


Symmetrical Triangle Pattern contains at least two lower highs (peaks) and two higher lows (troughs). When the peak as well as trough points are connected by separate lines and then extended to the right, they would respectively form a descending upper line and an ascending lower line, creating a pattern that looks like a symmetrical triangle.
In this case, the descending upper line acts as resistance, whereas the ascending lower line as support.

This pattern occurs because the highs (peaks) are moving progressively lower, whereas the lows (troughs) are moving progressively higher.
As the range between the peaks and troughs are narrowing, the upper & lower lines converge at the "Apex", which is located at the right of the triangle.
The completion of the pattern occurs when prices break out through either the upper line (i.e. breakout to the upside) or lower line (i.e. breakout to the downside) before finishing the apex of the triangle.

A triangle pattern may sometimes be associated with a �coil�. A �coil� needs to recoil (contract) in order to build up enough potential energy for its next expansion.

The pattern implies that buyers and sellers are in a period where they still hesitate where the market is heading. However, in the end, either the buyers or sellers managed to find enough conviction to break out to one side with great force.

To be continued to Part 2: Important Characteristics of Symmetrical Triangle pattern.

To read about other chart patterns, go to: Learning Charts Patterns.

Related Posts:
* Learning Candlestick Charts
* Options Trading Basic � Part 2
* Understanding Implied Volatility (IV)
* Option Greeks

DESCENDING TRIANGLE PATTERN � Part 2: Important Characteristics

Go back to Part 1: Descending Triangle Formation.

Important Characteristics of Descending Triangle

Existing Trend:
There should be an established existing trend (normally downtrend) in order for the pattern to qualify as a continuation pattern

Shape of Descending Triangle:
* There should be at least two equal troughs (lows) forming a horizontal lower line, and two successively lower peaks (highs) forming a descending upper line that converges on the lower line as it slopes downward (If both lines were extended right).
* There should be some distance between the two peaks as well as the two troughs.
In other words, prices should increase and hit the downward sloping upper line then decline for at least twice (forming at least two peaks). Prices should drop and hit the lower line then bounce up for at least twice (forming at least two troughs).
* The lower line does not need to be completely horizontal, but it should be close to horizontal.
* The troughs (lows) do not have to be exactly the same in value, but they should be reasonably close.
* Prices should bounce back and forth in a quite regular pattern as the Triangle develops.

Volume:
Volume should be diminishing; heavy at the beginning and contracts as the pattern develops.
However, when breakout occurs, there should be a significant increase in volume.

This is because during the development of the pattern, investors are still undecided. Some are holding on to their stocks, awaiting the market's next move, whereas the others are buying and selling sooner, which translates into a narrowing range of the peaks and troughs.
When breakout finally occurs, volume should increase significantly, because investors finally have enough conviction about the market direction and they are eager to release their pent-up supply or demand.

Duration:
On a daily chart, this pattern usually may take about 1 to 3 months to form.

Generally, the longer it takes to form the triangle (or the longer the timeframe of the triangle formation), the stronger the breakout would be.

Potential Price Target:
1) Compute the height of the triangle at its widest part (on the left of the chart).
The height is determined by projecting & measuring a vertical line from the highest high point on upper line to the horizontal lower line.
2) Subtract the result from the breakout point (i.e. the horizontal lower line) to get the potential price target.

Return to Breakout Level:
After the breakout through the lower line occurred, it is common that prices could bounce back to the lower line for an immediate test of this new resistance before resuming their downward moves.
This is because the lower line that previously acted as support now turns into resistance.
(Remember the basic principle of technical analysis that resistance turns into support, or vice versa).
However, it should not reenter the triangle and/or even close above the upper line.

Breakout Direction:
Although Descending Triangle is generally considered as bearish pattern (i.e. the breakout should be to the downside), it may sometimes break to the upside instead (i.e. break out through the upper line).

When Breakout Should Occur:
The breakout from a triangle pattern should occur well before the pattern reaches the apex of the triangle (i.e. should be somewhere between two-thirds and three-quarters of the horizontal width of the triangle).
If breakout does not occur beyond the three-quarter point, it might mean that prices would continue to drift out to the apex and beyond. In other words, the pattern may no longer valid.

False Breakout:
Premature / false breakouts or "shakeouts" often happen to this pattern as well. The following are a few points to take note in order to try to avoid false breakout:

* A minimum penetration criteria for a breakout should be price closes below the lower line (when breakout to the downside) or the upper line (when breakout to the upside), not just an intraday penetration.
Some investors / traders may apply certain price criteria (e.g. 3% - 5% break from the upper / lower line, depending on the stock�s volatility) or time criteria (e.g. the breakout is sustained for 3 days) to confirm the validity of the breakout.

* Normally, a breakout from a triangle pattern occurs due to an �event� or new development that is able to provide enough conviction to the investors / traders to move strongly to a certain direction.
Therefore, some possible confirmation for a valid breakout could be price gaps or accelerated price movements, which are accompanied by a significant increase in volume.

* When a breakout is not accomplished by high volume, investors / traders should be cautious. Because a good breakout from a triangle formation should happen with a noticeable surge in volume. However, not all breakouts with high volume are reliable either. A false breakout may also occur with high volume.
Therefore, the price action on the following days should be watched carefully. It is sometimes wise to wait a few days to determine whether the breakout is a valid one. Hence, some investors / traders prefer to take positions when the prices return to the breakout level to test the new support / resistance before resuming their moves to the breakout direction (although this return does not always happen), because this may offer an opportunity to participate in the breakout with a better reward to risk ratio.

* When the breakout occurs very close to the apex, investors / traders should be extra cautious. Because the chances of a false breakout are very high as the volume is thin at this point. Hence, it would only take very little activity to cause an erratic and false movement that takes the price outside of the upper or lower lines.

To read about other chart patterns, go to: Learning Charts Patterns.

Related Posts:
* Learn Technical Analysis from LINDA RASCHKE for FREE
* Learning Candlestick Charts
* Options Trading Basic � Part 2
* Understanding Implied Volatility (IV)
* Option Greeks

DESCENDING TRIANGLE PATTERN � Part 1: Formation

Descending Triangle is a bearish pattern that normally forms in the midst of a downtrend as a continuation / consolidation pattern.
However, sometimes this pattern may also be found at the top of an uptrend, signaling a potential reversal of trend.

The Formation of Descending Triangle


Descending Triangle has a decreasing (downward sloping) upper line and a flat / horizontal lower line, forming a pattern that looks like a flat-bottom triangle.
In this case, the decreasing upper line acts as resistance, whereas the horizontal lower line as support.

This pattern occurs because the lows (troughs) are maintaining at about the same price levels, whereas the highs (peaks) are moving gradually lower.
As the range between the peaks and troughs are narrowing, the upper & lower lines converge at the "Apex", which is located at the right of the triangle.
The completion of the pattern occurs when prices break down through the horizontal lower line before finishing the apex of the triangle.

This pattern is usually considered as bearish pattern. The progressively lower highs that form the declining upper line indicate increased selling pressures, which give the Descending Triangle pattern a bearish bias.

The pattern implies that buyers and sellers are in a period where they are still hesitant about where the market is heading. However, sellers seem to be more aggressive than buyers, as the highs progressively get lower, while the lows are always holding about the same level. In the end, the sellers overpower the buyers and break down to the downside with great force.

Therefore, a triangle pattern may sometimes be associated with a �coil�. A �coil� needs to recoil (contract) in order to build up enough potential energy for its next expansion.

To be continued to Part 2: Important Characteristics of Descending Triangle pattern.

To read about other chart patterns, go to: Learning Charts Patterns

Related Posts:
* Learning Candlestick Charts
* Options Trading Basic � Part 2
* Understanding Implied Volatility (IV)
* Option Greeks

ASCENDING TRIANGLE PATTERN � Part 2: Important Characteristics

Go back to Part 1: Ascending Triangle Formation

Important Characteristics of Ascending Triangle Pattern

Existing Trend:
There should be an established existing trend (normally uptrend) in order for the pattern to qualify as a continuation pattern.

Shape of Ascending Triangle:
* There should be at least two equal peaks (highs) forming a horizontal upper line, and two successively higher troughs (lows) forming an ascending lower line that converges on the upper line as it slopes upward.
* There should be some distance between the two peaks as well as the two troughs.
In other words, prices should increase and hit the upper line then decline for at least twice (forming at least two peaks). Prices should drop and hit the upward sloping lower line then bounce up for at least twice (forming at least two troughs).
* The upper line does not need to be completely horizontal, but it should be close to horizontal.
* The peaks (highs) do not have to be exactly the same in value, but they should be reasonably close.
* Prices should bounce back and forth in a quite regular pattern as the Triangle develops.

Volume:
Volume should be diminishing; heavy at the beginning and contracts as the pattern develops.
However, when breakout occurs, there should be a significant increase in volume.

This is because during the development of the pattern, investors are still undecided. Some are holding on to their stocks, awaiting the market's next move, whereas the others are buying and selling sooner, which translates into a narrowing range of the peaks and troughs. (They profit take or short sell at the upper line that acts as resistance).
When breakout finally occurs, volume should increase significantly, because investors finally have enough conviction about the market direction and they are eager to release their pent-up supply or demand.

Duration:
On a daily chart, this pattern usually may take about 1 to 3 months to form.

Generally, the longer it takes to form the triangle (or the longer the timeframe of the triangle formation), the stronger the breakout would be.

Potential Price Target:
1) Compute the height of the triangle at its widest part (on the left of the chart).
The height is determined by projecting & measuring a vertical line from the horizontal upper line to the lowest low point on the lower line.
2) Add the result to the breakout point (i.e. horizontal upper line) to get the potential price target.

Return to Breakout Level:
After the breakout through the upper line has occurred, it is common that prices could retrace to the upper line for an immediate test of this new support before resuming their upward moves.
This is because the upper line that previously acted as resistance has now turned into support.
(Remember the basic principle of technical analysis that resistance turns into support, or vice versa).
However, it should not reenter the triangle and/or even close below the lower line.

Breakout Direction:
Ascending Triangle is generally considered as bullish pattern (i.e. the breakout should be to the upside).
Nevertheless, it may sometimes break to the downside too (i.e. break down through the lower line).

When Breakout Should Occur:
The breakout from a Triangle pattern should occur well before the pattern reaches the apex of the triangle (i.e. should be somewhere between two-thirds and three-quarters of the horizontal width of the triangle).
If breakout does not occur beyond the three-quarter point, it might mean that prices would continue to drift out to the apex and beyond. In other words, the pattern may no longer valid.

False Breakout:
Premature / false breakouts or "shakeouts" often happen to this pattern as well.
The following are a few points to take note in order to try to avoid false breakout:

* A minimum penetration criteria for a breakout should be price closes outside the upper line (when breakout to the upside) or lower line (when breakout to the downside), not just an intraday penetration.
Some investors / traders may apply certain price criteria (e.g. 3% - 5% break from the upper / lower line, depending on the stock�s volatility) or time criteria (e.g. the breakout is sustained for 3 days) to confirm the validity of the breakout.

* Normally, a breakout from a triangle pattern occurs due to an �event� or new development that is able to provide enough conviction to the investors / traders to move strongly to a certain direction.
Therefore, some possible confirmation for a valid breakout could be price gaps or accelerated price movements, which are accompanied by a significant increase in volume.

* When a breakout is not accomplished by high volume, investors / traders should be cautious. Because a good breakout from a triangle formation should happen with a significant increase in volume. However, not all breakouts with high volume are reliable either. A false breakout may also occur with high volume.
Therefore, the price action on the following days should be watched carefully. It is sometimes wise to wait a few days to determine whether the breakout is a valid one. Hence, some investors / traders prefer to take positions when the prices return to the breakout level to test the new support / resistance before resuming their moves to the breakout direction (although this return does not always happen), because this may offer an opportunity to participate in the breakout with a better reward to risk ratio.

* When the breakout occurs very close to the apex, investors / traders should be extra cautious. Because the chances of a false breakout are very high as the volume is thin at this point. Hence, it would only take very little activity to cause an erratic and false movement that takes the price outside of the upper or lower lines.

To read about other chart patters, go to: Learning Charts Patterns

Related Posts:
* Learning Candlestick Charts
* Options Trading Basic � Part 2
* Understanding Implied Volatility (IV)
* Option Greeks
* FREE Trading Videos from Famous Trading Gurus

Reading Links

ASCENDING TRIANGLE PATTERN � Part 1: Formation

Ascending Triangle is a bullish pattern that normally forms in the midst of an uptrend as a continuation / consolidation pattern.
However, sometimes this pattern may also be found at the bottom of a downtrend, signaling a potential reversal of trend.

The Formation of Ascending Triangle


Ascending Triangle has a flat / horizontal upper line and an ascending (upward sloping) lower line, forming a pattern that looks like a flat-top triangle.
In this case, the horizontal upper line acts as resistance, whereas the rising lower line as support.

This pattern occurs because the highs (peaks) are maintaining at about the same price levels, whereas the lows (troughs) are moving progressively higher.
As the range between the peaks and troughs are narrowing, the upper & lower lines converge at the "Apex", which is located at the right of the triangle.

The completion of the pattern occurs when prices break out through the horizontal upper line before finishing the apex of the triangle.

This pattern is usually considered as bullish pattern.
The progressively higher lows that form the ascending lower line indicate increased buying pressures, which give the Ascending Triangle pattern a bullish bias.

The pattern implies that buyers and sellers are in a period where they are still hesitant about where the market is heading. Nevertheless, buyers seem to be more aggressive than sellers, as the lows gradually get higher, while the highs are always holding about the same level. In the end, the buyers find enough conviction to break out to the upside with great force.

Therefore, a triangle pattern may sometimes be associated with a �coil�.
A �coil� needs to recoil (contract) in order to build up enough potential energy for its next expansion.

Continue to Part 2: Important Characteristics of Ascending Triangle pattern.

To read about other chart patterns, go to: Learning Charts Patterns

Related Topics:
* Learning Candlestick Charts
* Options Trading Basic � Part 2
* Understanding Implied Volatility (IV)
* Option Greeks
* Getting Started Trading

Chart Patterns � Introduction

What Is Chart Patterns?
Chart Patterns
provide a complete, concise pictorial documentation of all buying and selling (supply and demand) forces.
Chart Patterns allow investors / traders to analyze the battle between bulls (buyers) & bears (sellers) and help determine who win the battle, so that they can position themselves accordingly.

Why Chart Patterns Can Help In Trading / Investing?
Because price patterns form as a result of market psychology.
Although a chart only presents stock prices & volume, it actually reflects human behavior, psychology and reactions towards the forces of supply vs. demand.
For example:
A consolidation pattern (sideways movement) does not develop because the pattern is controlling price movement.
A consolidation pattern develops because there is no enough belief or confidence in the market that the price should be heading up or down. Here, investors / traders are still trying to analyze the market to come at a conclusion about where they think the stock price should be heading based on their new price expectations for the stock.
Usually, the price will trade sideways until an �event� occurs to shift the market�s psychology one way or the other, which then results in a price breakout from the consolidation pattern.
The investors / traders who observe the pattern could then assume positions to trade or �ride� the breakout move.

Types of Chart Patterns
Chart patterns can generally be grouped into 2 types of patterns:

1) Continuation patterns:
Continuation patterns are price patterns that are formed in periods of price consolidation during a trend. They suggest that the market is still not sure where the price should be heading, but ultimately deciding to confirm the existing trend.
Hence, when price breaks out from this consolidation period, it is usually in the direction of the trend.
Continuation patterns offer opportunities to take or add to a position.
The following are some Continuation patterns:
Ascending Triangle, Descending Triangle, Symmetrical Triangle, Bullish / Bearish Flag, Bullish / Bearish Pennant, Rectangle, Price Channel, Cup and Handle.

2) Reversal patterns:
Reversal patterns are price patterns that occur at the end of the trend.
These patterns imply the market momentum is slowing and provide signals that a trend may be coming to an end and that prices may change direction.
The following are some Reversal patterns:
Head And Shoulders Top, Head And Shoulders Bottom, Double Tops, Double Bottom, Triple Tops, Triple Bottoms, Falling Wedge, Rising Wedge, Saucer / Rounding Bottom.

A Few Caution Notes
* Identifying, analyzing & interpreting chart patterns are more of an art than science. It�s quite subjective and needs some degree of imagination & skills to identify them.
* Some patterns are easier to identify and repeat themselves quite frequently, while others are more difficult to be recognized and rarely formed.
* Different market, industries and stocks can behave differently.
For instance, some stocks are more volatile than the others; some stocks often experience gaps, whereas the gaps seldom occur in the other stocks, etc.
* No pattern provides certainty even though all the signals it gives comply the pattern characteristics / rules perfectly. Even a �perfect� pattern merely presents us a higher probability that it may behave as what we expect from the pattern. Pattern failures do happen frequently. Therefore, what is more important is money management.

In the next posts, we�ll cover various common chart patterns further.
Hope it can be useful for you. Stay tune. :)

Update:
To read about chart patterns, go to: Learning Charts Patterns

Related Posts:
* FREE Trading Educational Resources You Should Not Miss
* Learning Candlestick Charts
* Options Trading Basic � Part 2
* Understanding Implied Volatility (IV)
* Option Greeks

Technical Analysis � Definition & Assumptions

Many investors / traders use Technical Analysis to help them in their entry & exit strategies. Ideally, Technical Analysis should be used hand in hand with Fundamental Analysis, as the two methods have their own pros & cons.
However, some people argue that for short term trading (e.g. day trading, 1 � 5 days swing trading), Fundamental Analysis may not be as critical as that for longer term trading / investing.

The following would discuss further what Technical Analysis is and its basic assumptions.

What Is Technical Analysis?
Technical Analysis
is a method used to attempt to predict future stock prices based on historical prices and stock chart patterns / trends.
Technical analysis uses no information about the actual business or financial performance of the underlying company.
Technical analysis can be applied to an individual stock as well as market as a whole.

In contrast, Fundamental Analysis attempts to make investment decision based on the evaluation on the company's business & operation, overall financial health / condition, management quality, marketing aspects, future outlook of the company, industry factors, as well as economic and political conditions.
The Fundamental analysis will then compare the valuation with the prevailing market price to ascertain whether the stock is overpriced, underpriced, or priced in proportion to its market value.

The Basic Assumptions of Technical Analysis
* A stock price has factored in all known information (e.g. the stock� fundamental / intrinsic values, events, economic outlook and market psychology, etc.) about a stock.
As such, there is no need to study each factor individually, but instead just need to focus on the price behaviors only.
* Disregarding minor fluctuation, prices tend to move in trends.
However, prices do not move in a trend forever. When prices change direction, the move normally does not occur directly & obviously. Prices tend to move sideways first, fluctuating up and down, as investors try to analyze the market and arrive at a conclusion about where they think the stock price should be heading based on their new price expectations for the stock. These sideways movements cause price patterns to form on the chart.
* History will repeat itself, over and over again.
The price patterns tend to repeat, offering investors a prediction of where prices may be heading.This is possible because human behavior will never change. The repetitive & predictable human behavior, psychology and reactions towards various supply vs. demand forces are the foundation of technical analysis.

History repeats itself in the stock market. Many price patterns and price consolidation structures that stocks form are repeated over and over again.

William J. O'Neil


As Technical Analysis mainly uses charts patterns to predict future stock price behavior, it is commonly called as �Charting�.

In the next posts, we�ll discuss about chart patterns.
In the meantime, have a good weekend ahead. :)

Related Posts:
* Learning Charts Patterns
* Learning Candlestick Charts
* Options Trading Basic � Part 2
* Understanding Implied Volatility (IV)
* Option Greeks

Example On How Implied Volatility (IV) Affects Option�s Price Significantly

As discussed earlier, in options trading, Implied Volatility (IV) has a considerable impact on an option�s price. An option�s price can go up or down due to changes in IV, although there is no change in the stock price. Some times, for instance, we also find a stock price has increased, yet the Call option of the stock did not increased, but it dropped instead.
Now, let�s see a simple example on how IV affects an option�s price considerably.

In the prior post, it�s shown that IV will normally begin to rise starting from a few weeks before the announcement day. And once the announcement is out, the IV will drop significantly.

The fact that the IV will drop considerably right after the announcement is extremely important to note, particularly when you�re trading options by buying straight call / put options (directional play) or buying strangle / straddle (non-directional play) over earnings announcement.
This is typically the reason why you might see that the stock price has gapped up / down in your direction, but yet the option�s prices do not move profitably.
Why is it so?
Remember that, for both Call & Put options, an increase in IV will increase an option�s price, whereas a decrease in IV would decrease an option�s price.
(You may want to refer to the posts on Vega or Options Pricing for further discussion).

The increase in IV before the earnings announcement is to �anticipate� the volatility as a result of the announcement. In other words, certain magnitude of the price movement (either up or down) has been �priced in� by the increase in IV, which causes the option�s price to be more �expensive� than normal.
Once the announcement is out, the IV will drop significantly, which would affect the option�s price negatively.

Therefore, to be profitable in such cases, the increase / decrease in stock price must be big enough to offset the negative impact of the drop in IV on option�s prices.
And for strangle / straddle, the stock price movement must be even much bigger in order to offset both the drop on option�s prices at both legs (call & put legs) due to the drop in IV as well as the drop on option�s price at the other leg after the stock price moves to certain direction.

Therefore, in this case, it�s important to first assess the Reward / Risk ratio of a potential trade by inputting different scenarios of IVs and expected / target stock prices (using Options Calculator / Pricer).
By doing this, you can anticipate what your best & worst scenarios are, have your risk & return calculated, and determine if the trade is worth taking.

To understand more about Implied Volatility, go to: Understanding Implied Volatility (IV).

Related Topics:
* FREE Trading Videos from Famous Trading Gurus
* Options Trading Basic � Part 2
* Option Greeks

Reading Links